It takes days to find it

To find something anomalous one needs to be able to describe what is common. At PermissionBit we do that by recording every interaction between the CPU and the hardware (every system call). That gives us enough data to identify hacking, malware, and misuse. The time scales involved make this challenging. A computer does billions of things per second, while attacks take minutes to months to execute. The laws of physics and engineering constraints set the billions timescale, but what sets the timescale of an attack?
The time between an attacker attempting to gain access to a resource and succeeding is reported to be in seconds. While we have no evidence, we suspect this is a biased sample issue because most failed attacks are not investigated or reported. There are search engines that identify vulnerable internet connected servers and public exploits for outdated software, hackers can (with a little effort) break into many systems. But the process is not as straightforward as in the movies.
Once on an target machine, hackers need to find the data they want to steal. This may require additional privileges and compromising further resources. As every computer network is different in its own way, discovering what to do takes time and exploration. Sometimes attackers will notice a vulnerability and need to bring in the exploit; other times they may need a different set of credentials, so they need to wait until they are available. (On Windows this happens when credentials are used to log on to the compromised machine.) Black hat hacking is a patient art, even if it is very technical.
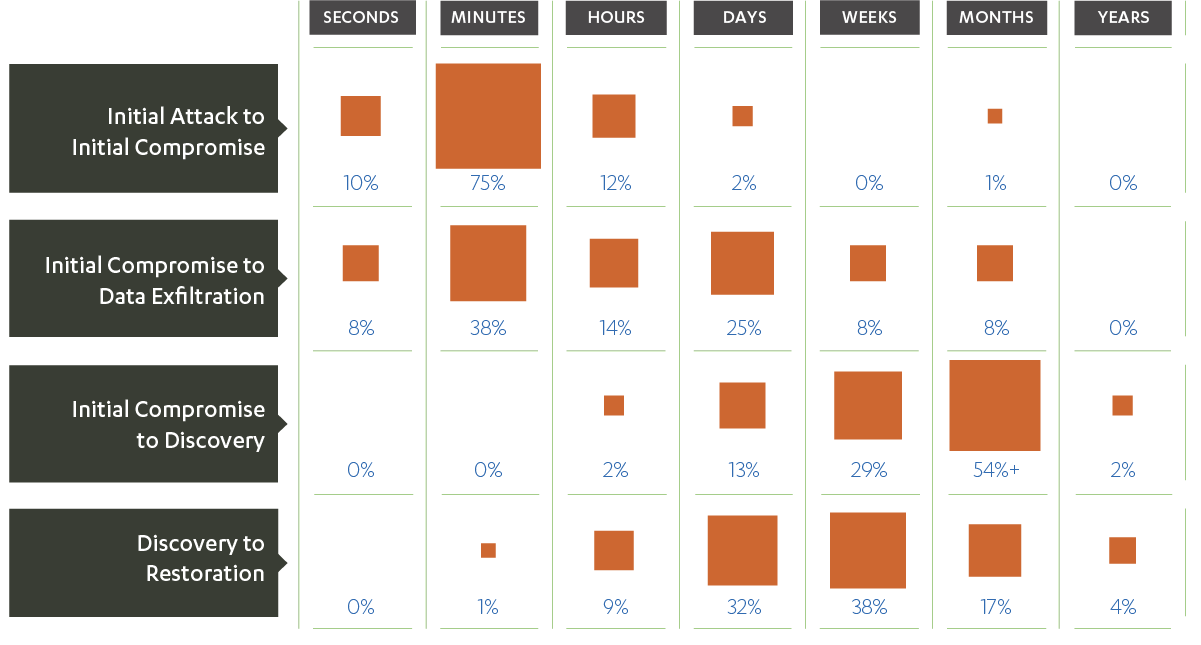
The exfiltration row in the chart above (second row) has two peaks: one for exfiltrations that happen in minutes, another for exfiltrations that happen in days. We read this as suggesting that in some cases the attackers took some known or standard file, or that the original compromise was not discovered. Alternatively there may have been an insider helping.
The data (and the original chart) are from the Verizon Data Breach Investigations Report (DBIR). Verizon’s investigative teams have compiled statistics from 2004 onwards for computer security incidents, which they have released as an annual report since 2008. Many of the reported incidents result in losses for the victim organizations in the form of data, money, or resources. The data are collected from organizations encoded using VERIS, a standardized language for annotating security incidents. The volume of records used to build the reports has grown steadily. In 2017 there were 42,068 incidents and 1,935 data breaches in the data set. A small fraction of the data is placed in the public domain through a community-driven data initiative. The common theme in the data is that discovery takes weeks to months.
The type of detail highlighted in the reports changes year-to-year. The figure above redoes Figure 40 from the 2012 report (which is similar to figure 41 from the 2013 report). The 2017 report summarized all such timelines in its Figure 8
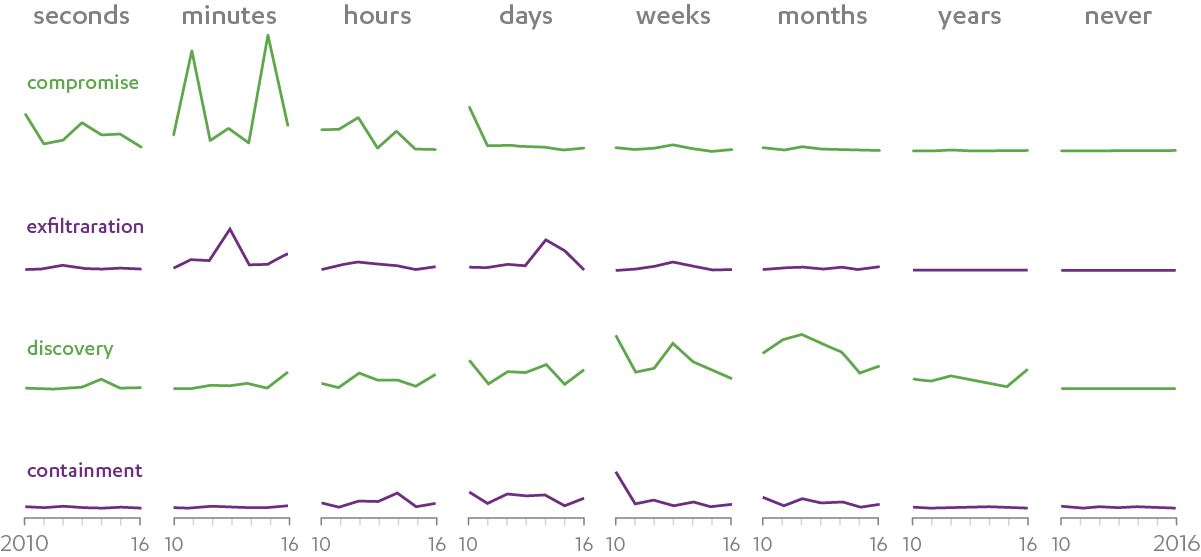
There are a lot of caveats that apply to the data in the DBIR reports. For example: the compromise curves include incidents with or without exfiltration; if the time between two incidents is large they may not be recorded as part of one campaign; and exfiltration may include uninteresting data, such as lists of files. The exfiltration time has become more spread out in 2017, with a slight peak on the timescale of minutes. Different classes of data exfiltrations may explain that. What we find unlikely is that attackers can discover what to take minutes after they first take interest in the target.